
MAY 2024
THE COST OF LIVING
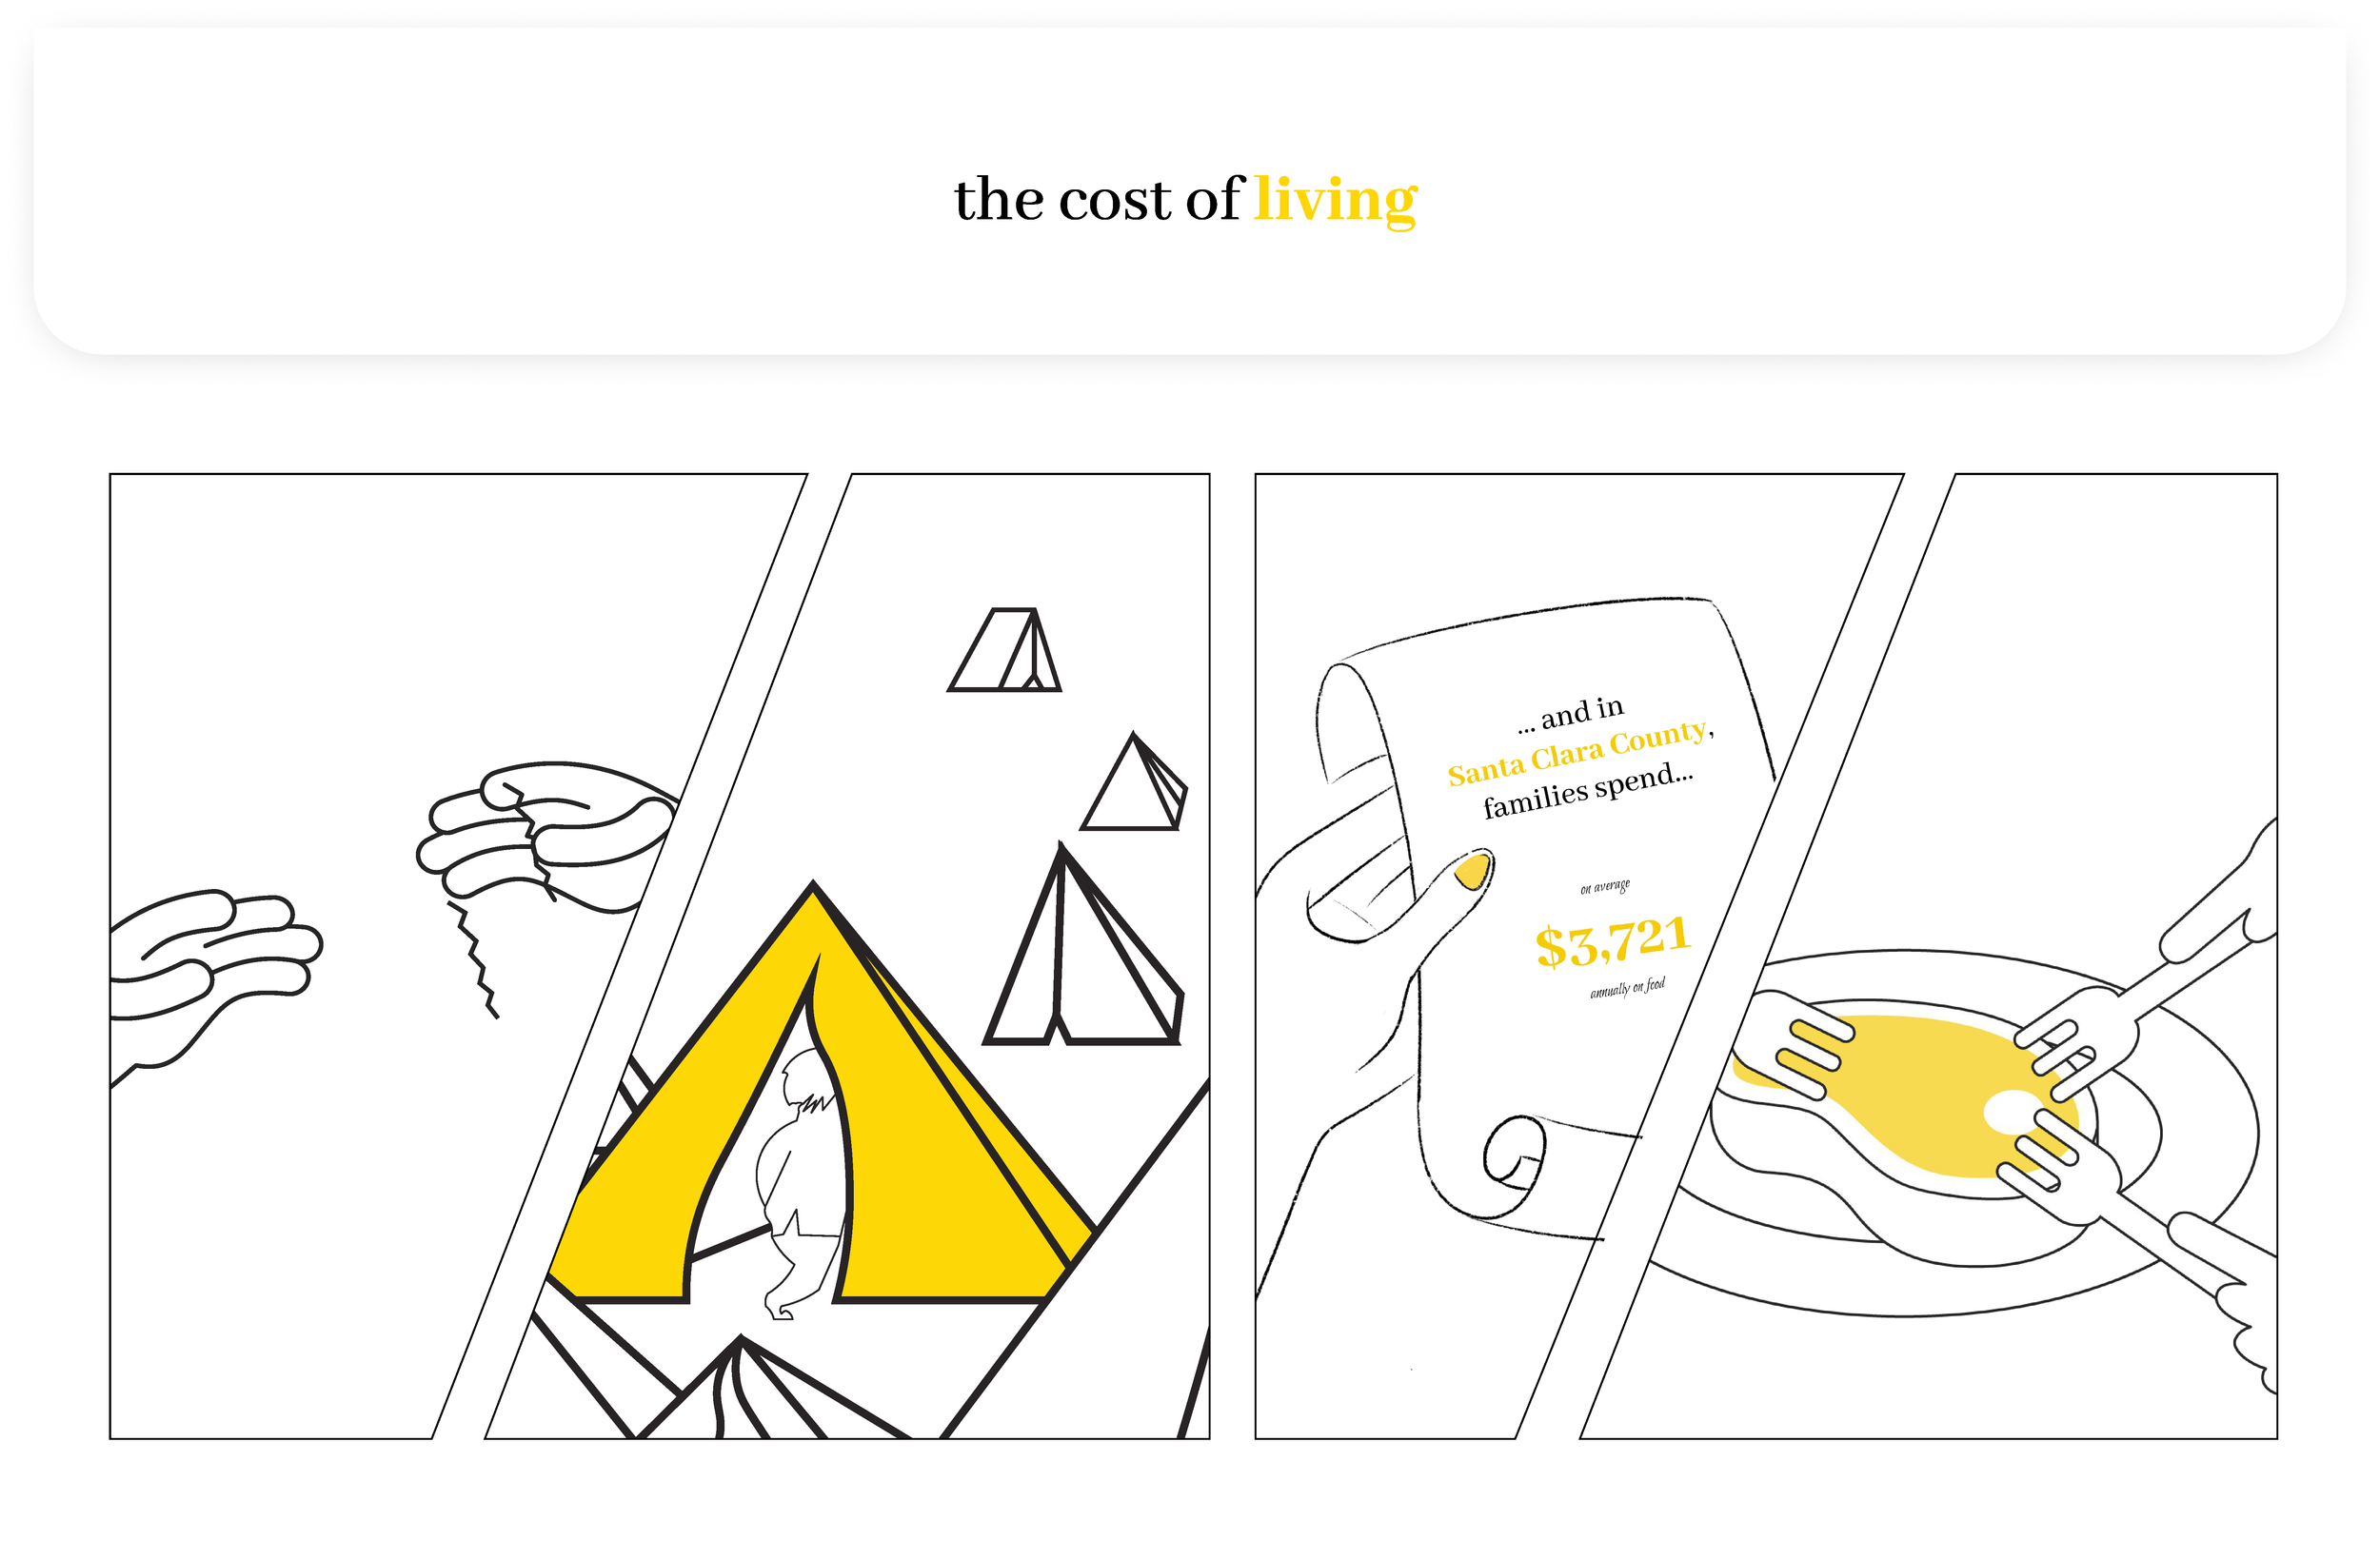
The Cost of Living is an interactive infographic that visualizes Santa Clara public health data from a 2024 health study. My team was asked to create an infographic that told the story of the cost of living in Santa Clara County, and my portion was specifically on how inflation affects the rising rate of food insecurity.
DATA VISUALIZATION, INFOGRAPHICS, ILLUSTRATION, UX/UI, PROTOTYPING, INTERACTION DESIGN
IDEATION
As a group, we decided on an illustrative direction with a minimal color palette. Since our data was very complex and required lots of graphs, we decided that a more minimalistic approach would make the interactive infographic more engaging and digestible.
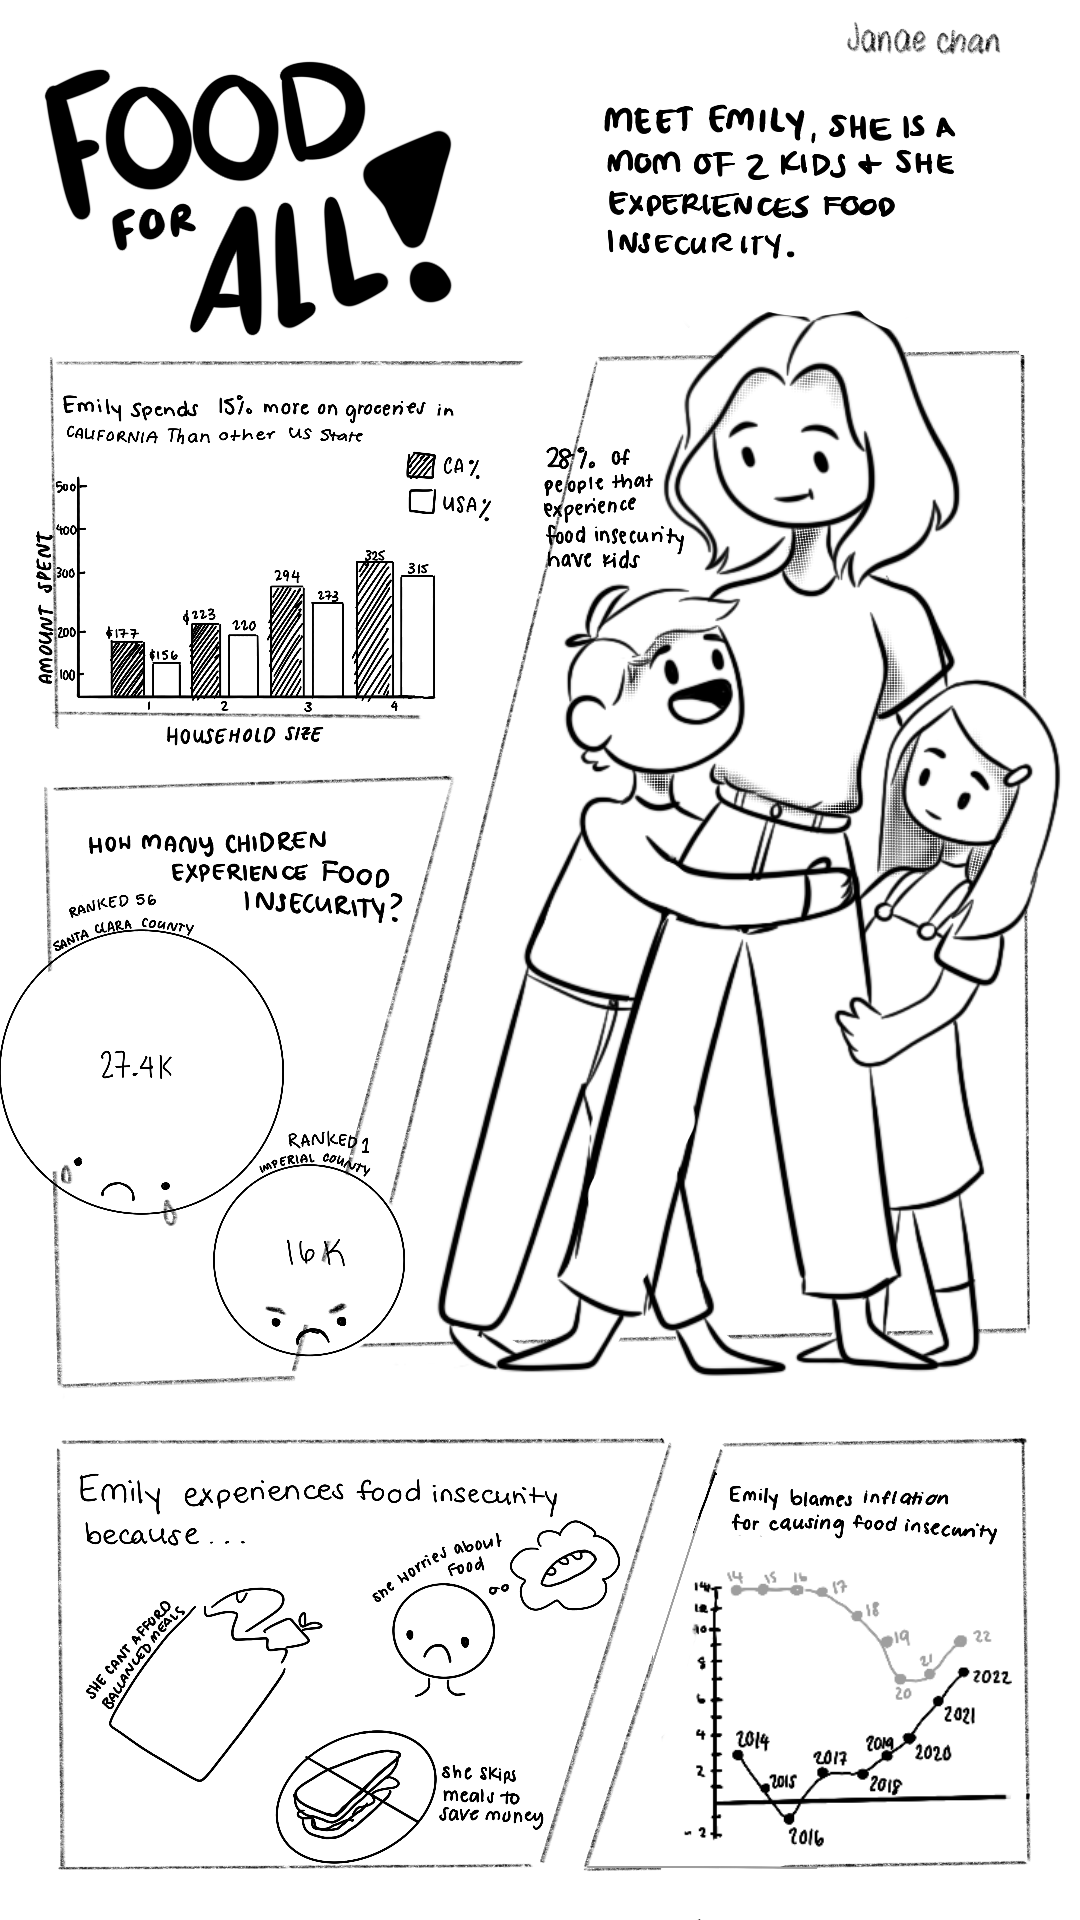
concept 1
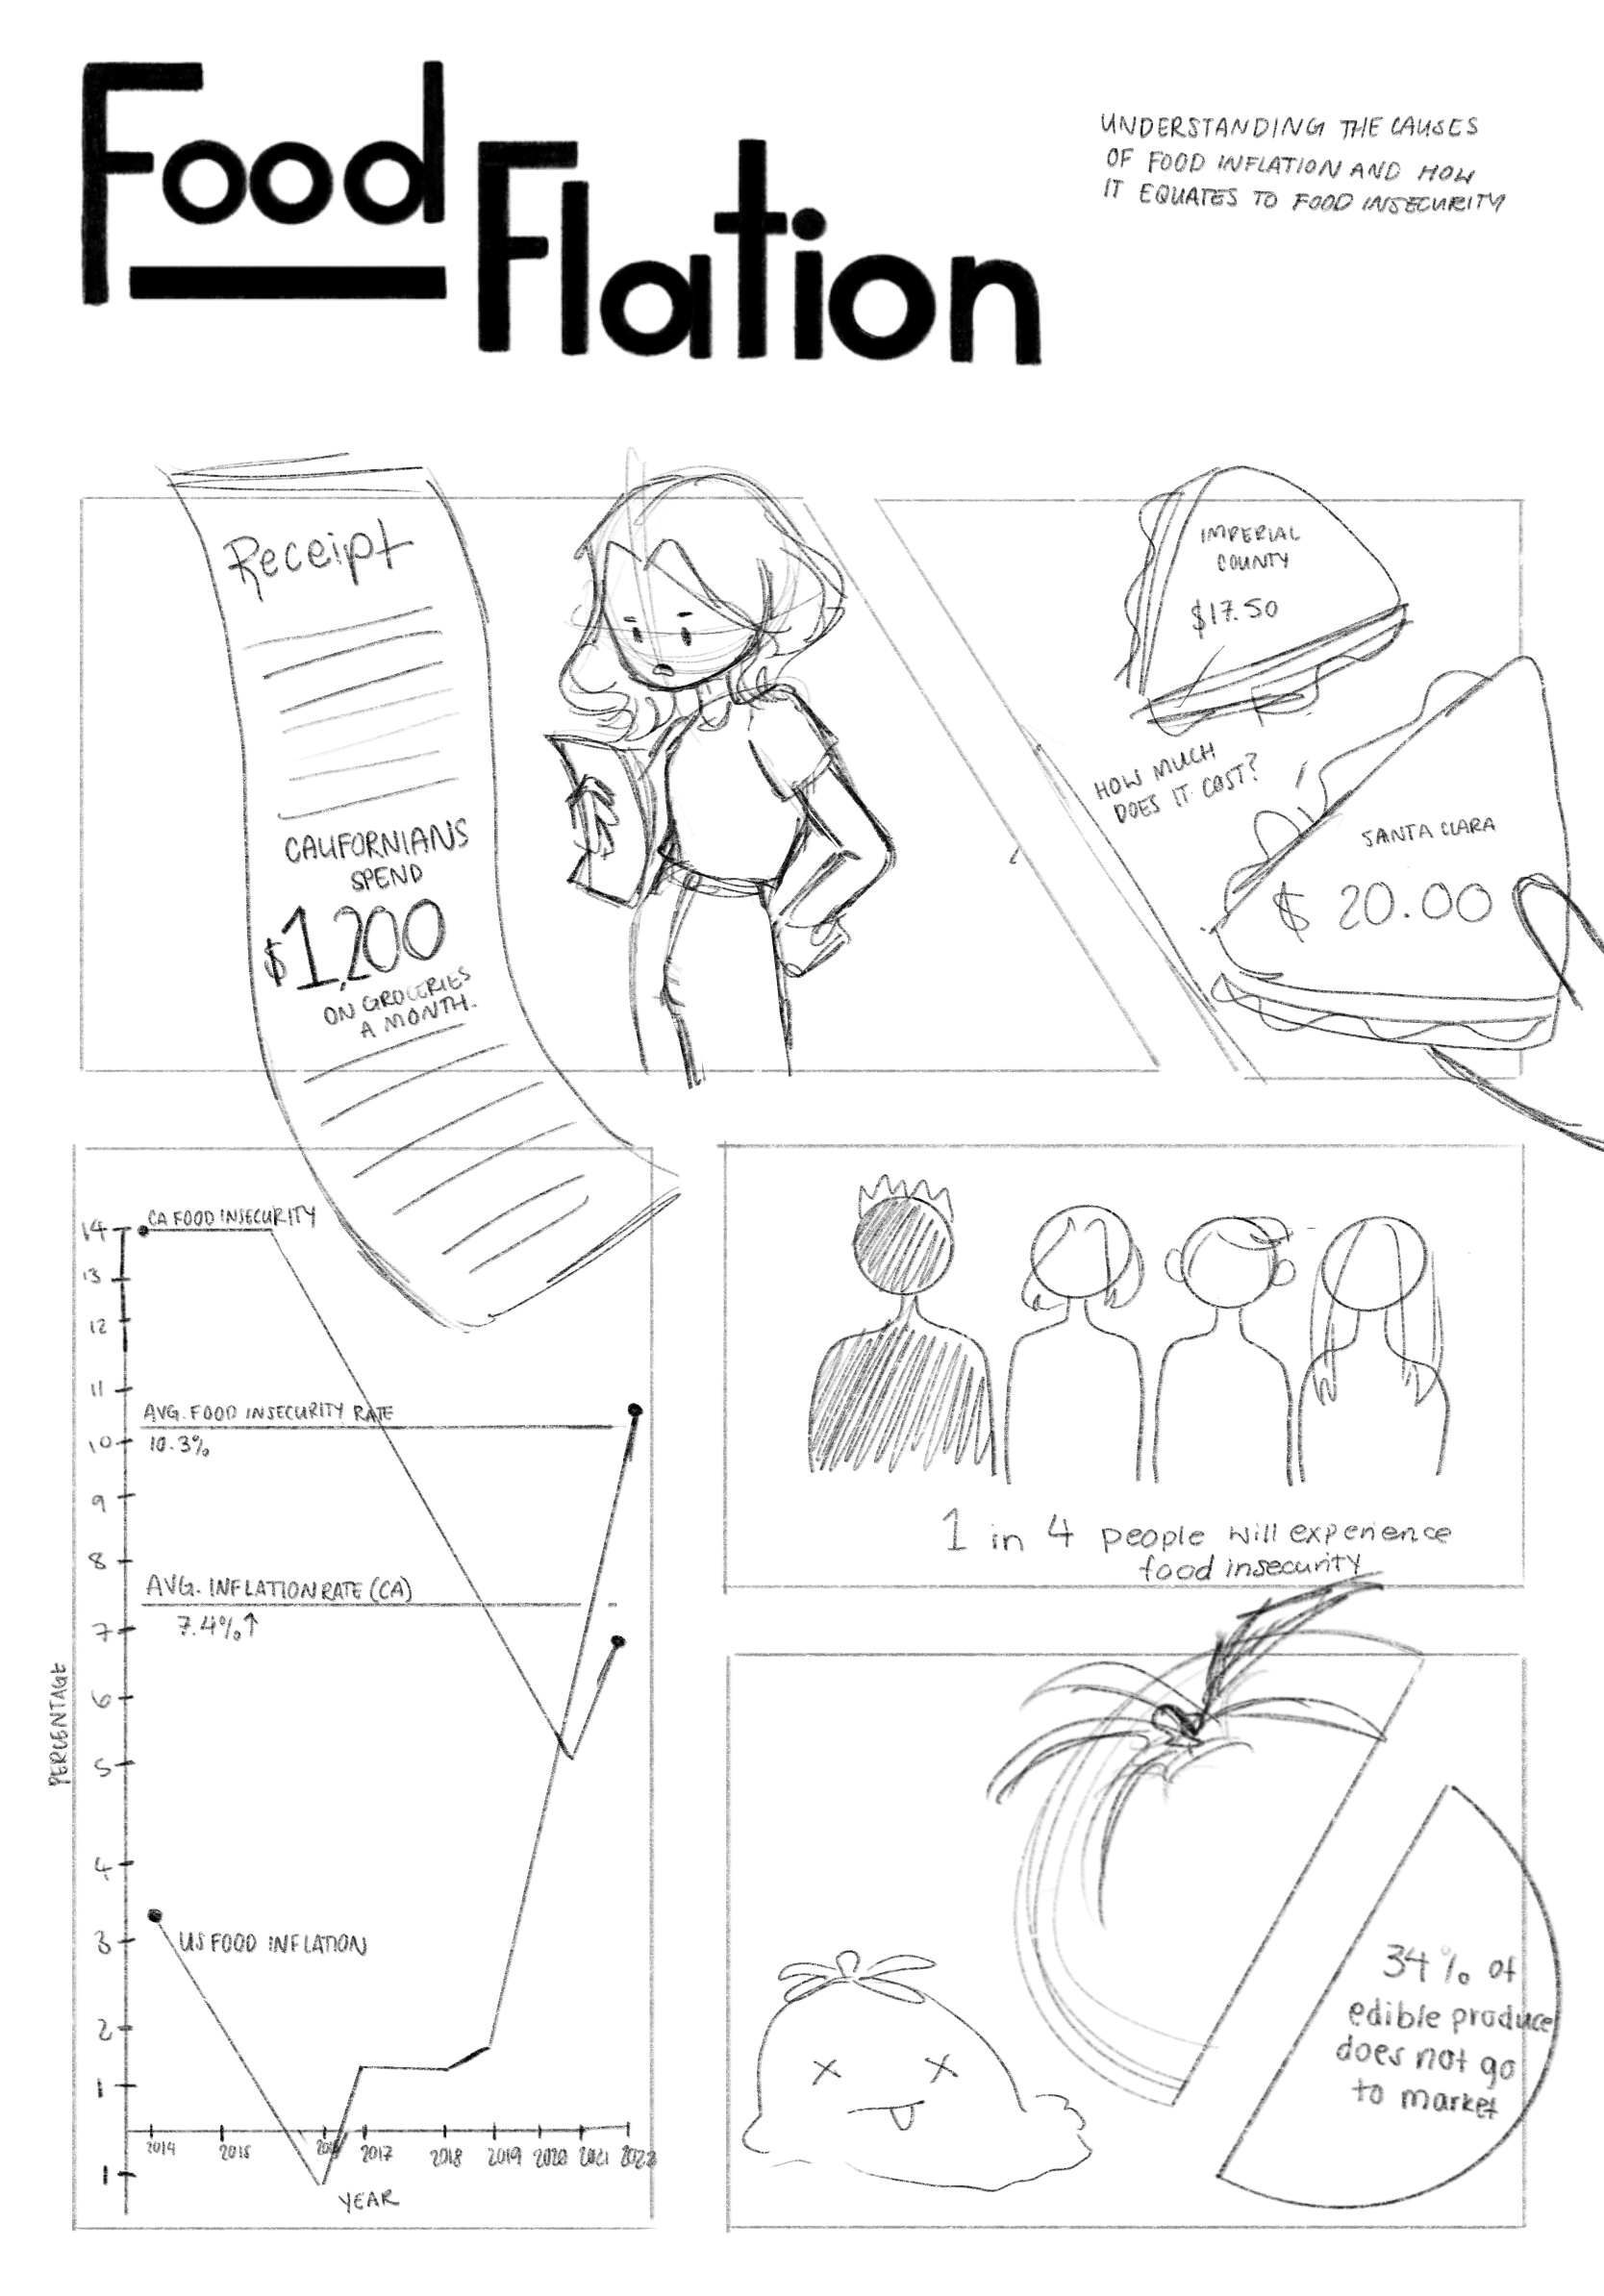
concept 2
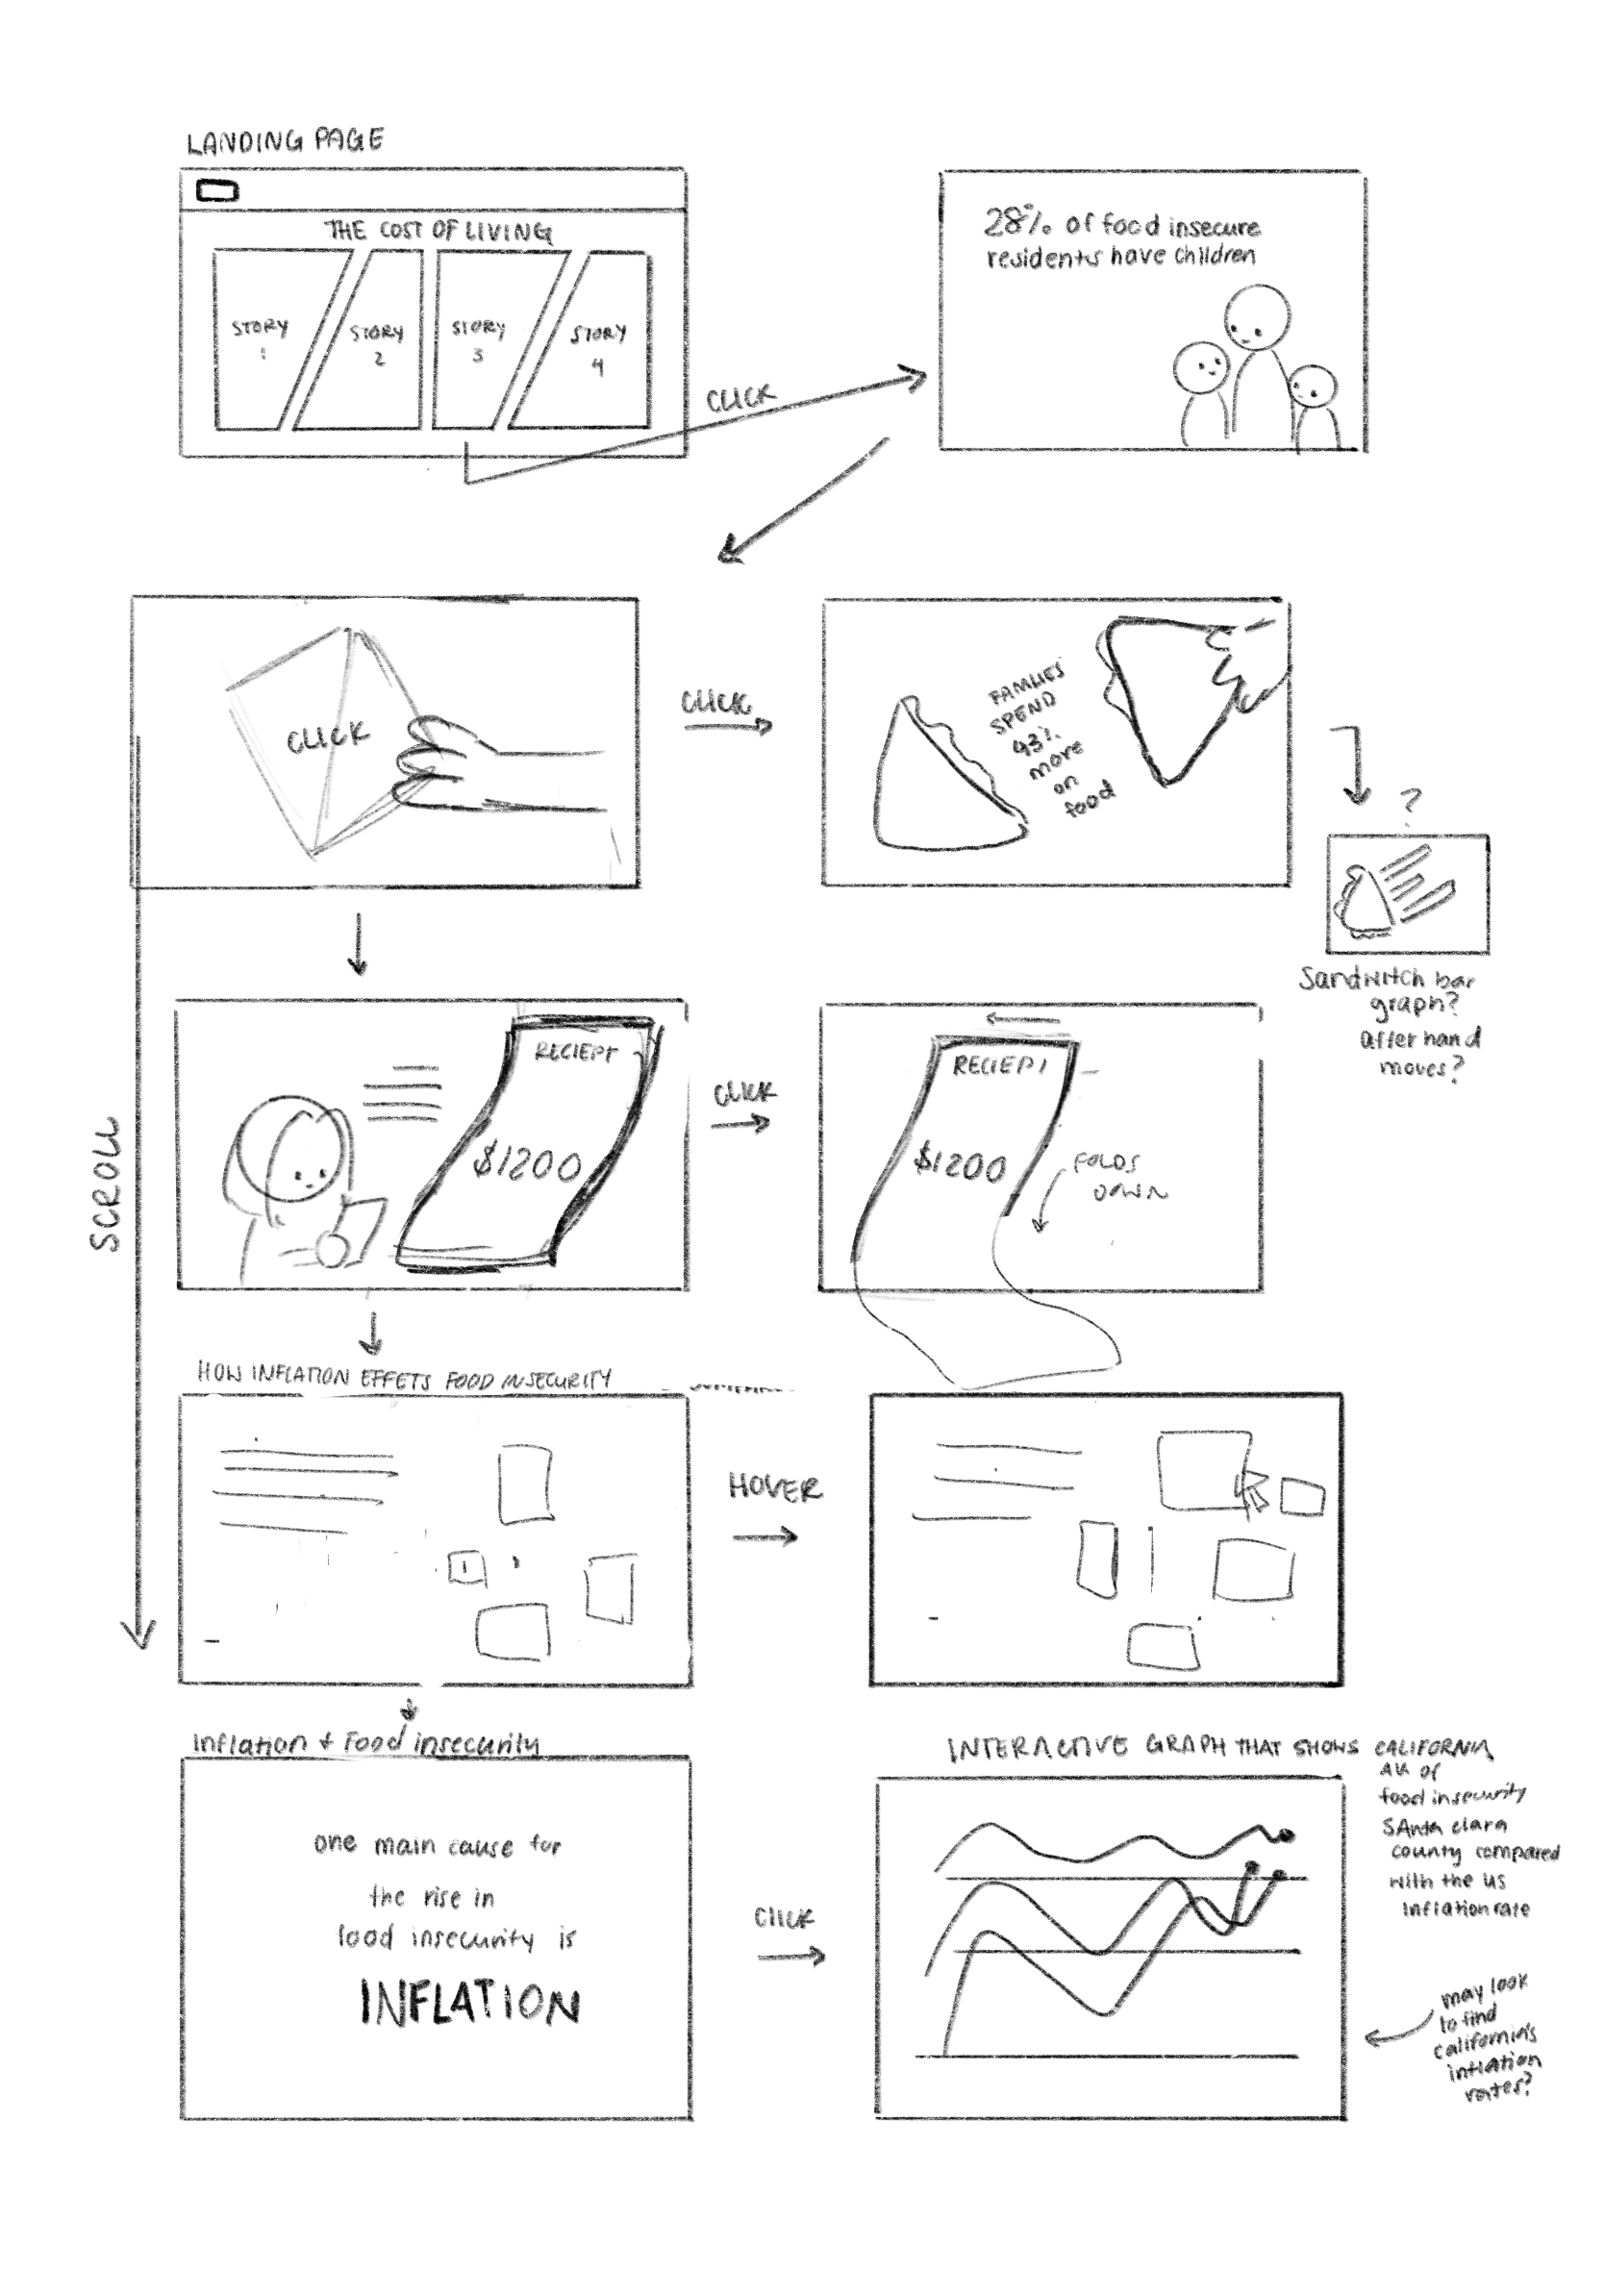
first wireframe
WIRE FRAMES + BASE INTERACTION
The infographic was designed to be a scroll interaction, with hovers, clicks and page jumps which allowed for the drawings themselves to be animated and interactive.
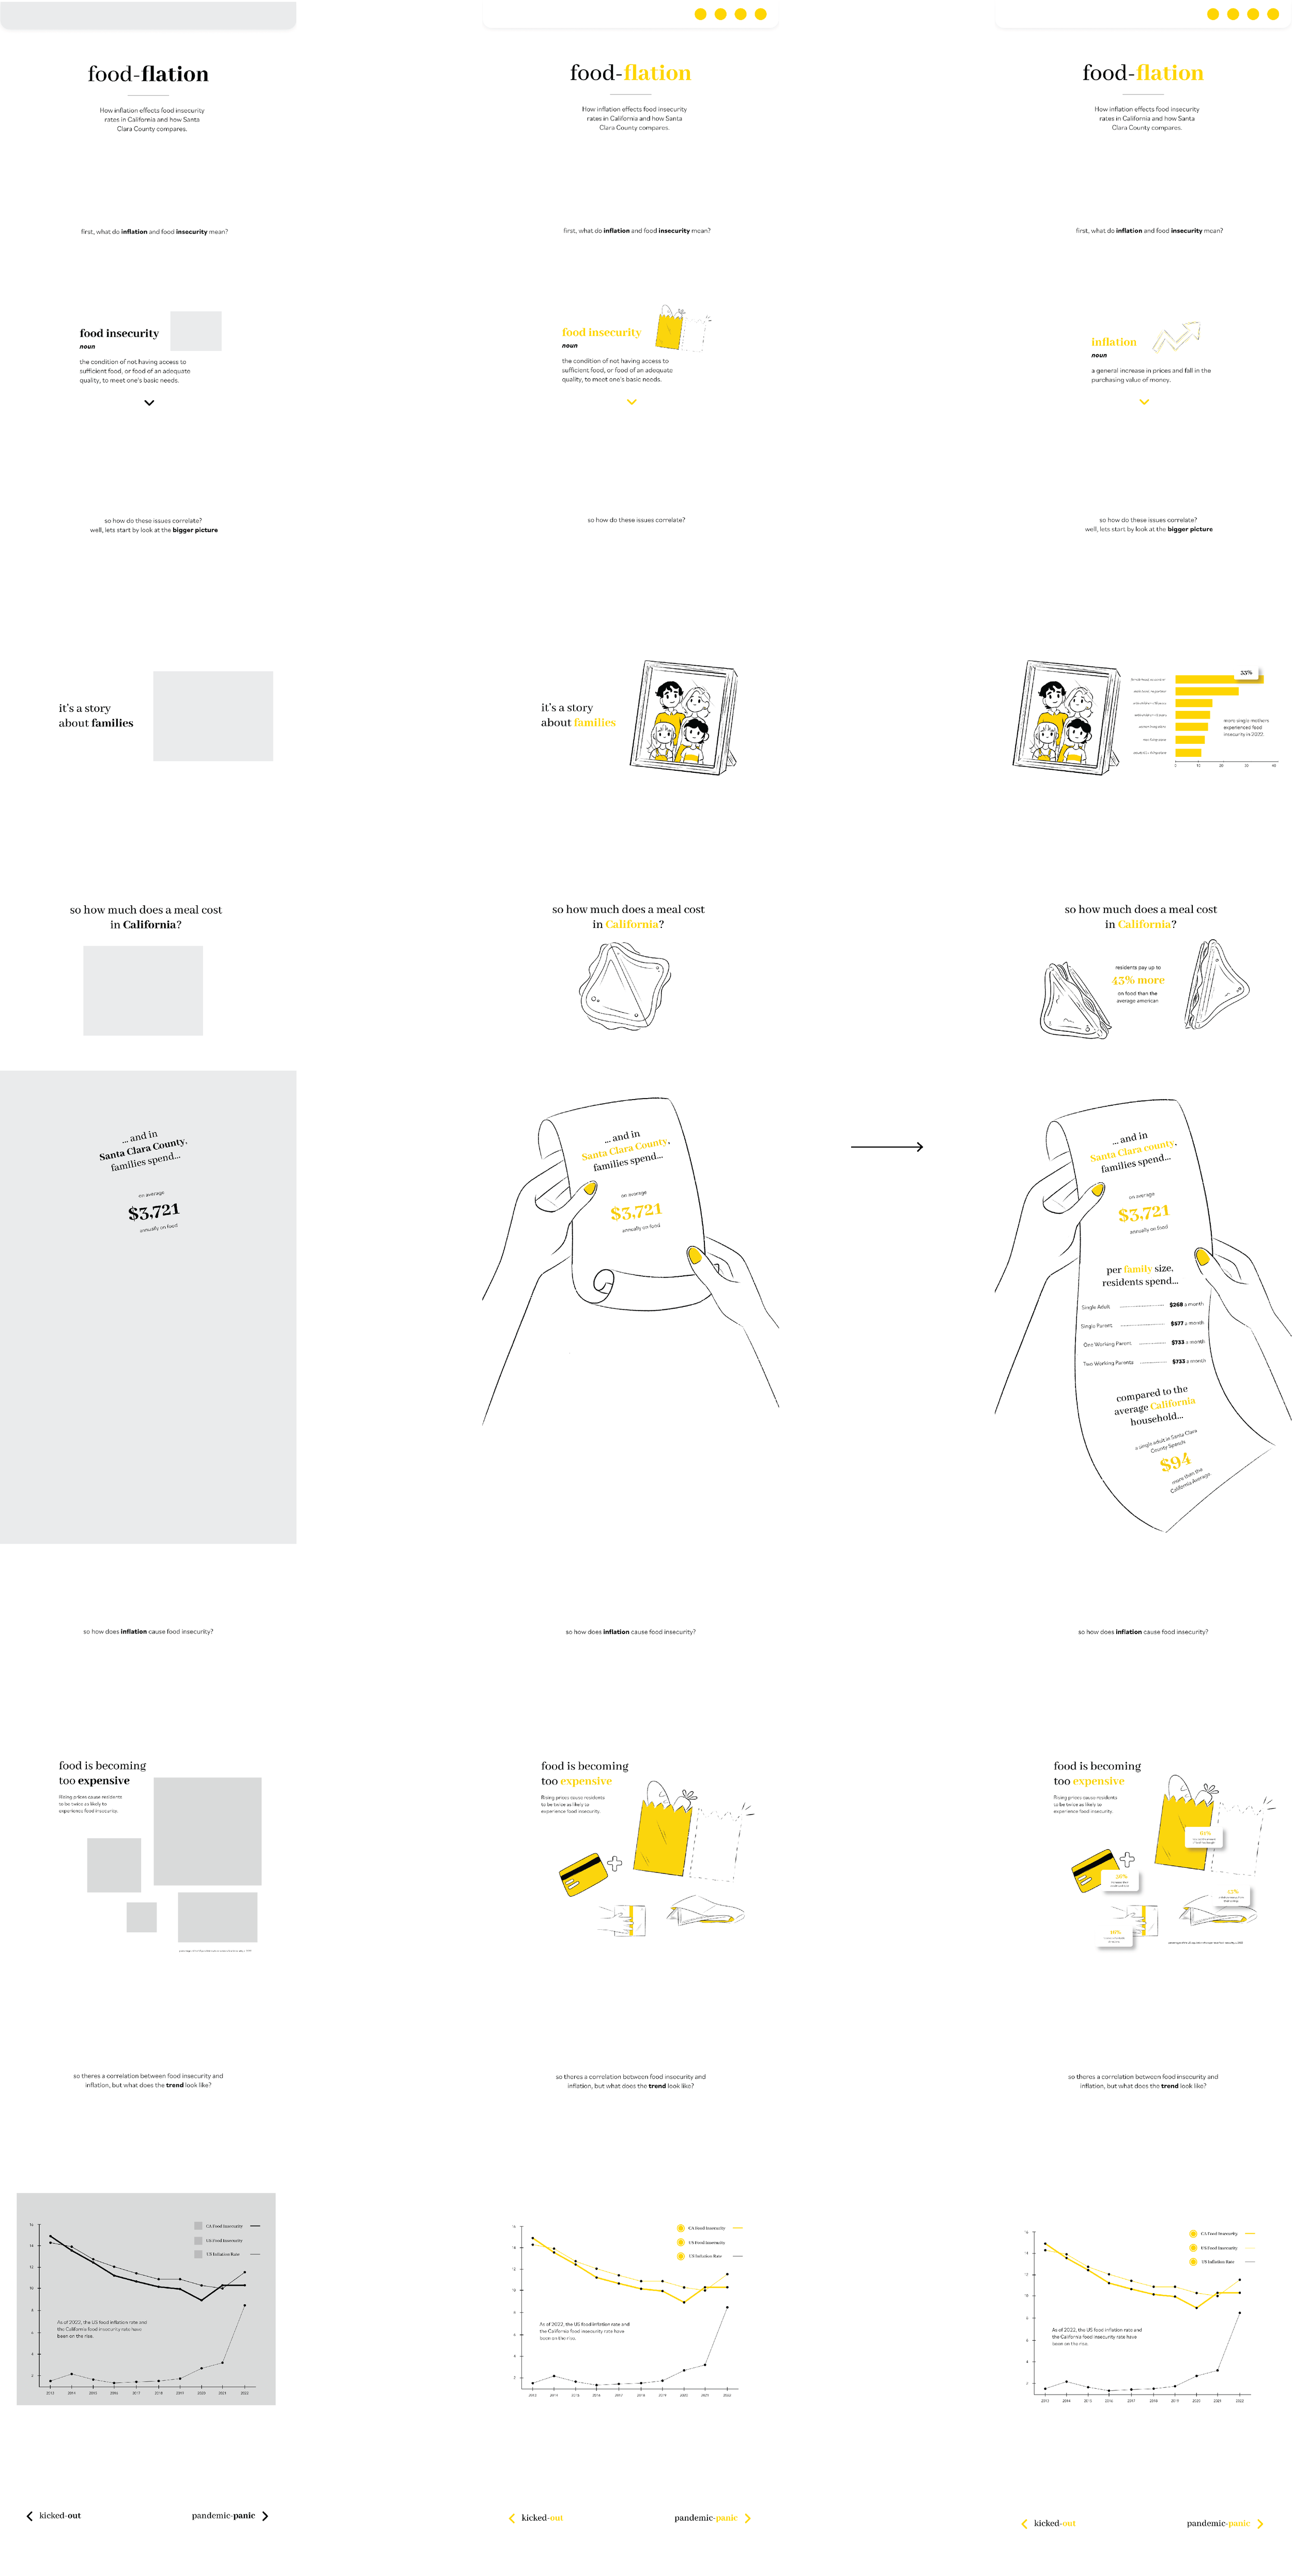
FINAL PROTOTYPE
The final outcome is a minimalistic interactive infographic that visualizes Santa Clara County health information and concerns. This project is merges graphic design with real life issues and it hopes to be a reliable, unbiased source for helpful information to the residents of Santa Clara County.
beside is a link to the full prototype
GROUP MEMBERS:
Ahmer Ahmed
Janae Chan
Margarita Grajeda
Vivian Zhao